import matplotlib.pyplot as plt
import numpy as np
import pandas as pd Community-Generated Lesson: Data Analysis of California Wildfires
This lesson will focus on the environmental impact of California Wildfires, focusing on changes in land cover, vegetation loss, and air quality before, during, and after major wildfire events. Using NASA datasets such as MODIS and VIIRS, users will learn how to access, visualize, and interpret satellite imagery to assess wildfire severity and its broader implications for ecosystems, air quality, and human health. In addition to analyzing spatial data, the lesson will integrate external datasets, such as air pollution measurements, to provide a more comprehensive understanding of wildfire impacts.
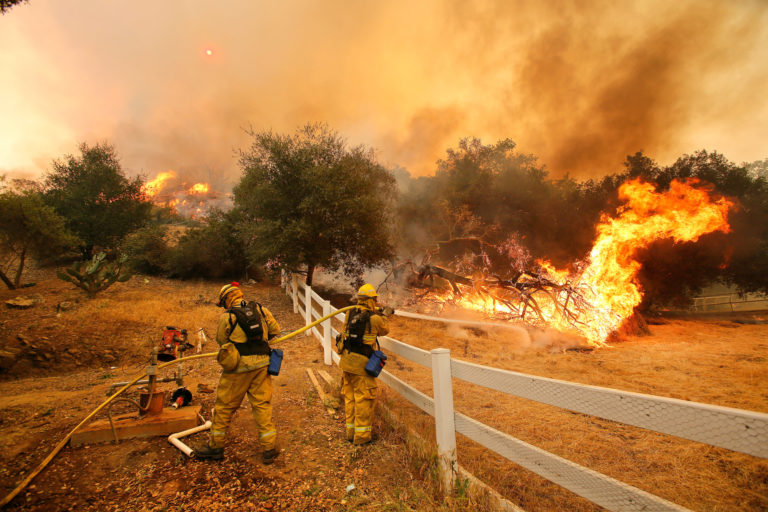
Wildfires in Los Angeles, California
Key Takeaways
- Learn techniques for downloading and processing satellite data.
- Identify areas affected by wildfires using spatial data.
- Analyze and interpret wildfire-related data for actionable insights.
- Integrate additional datasets, such as air quality measurements, for a comprehensive analysis.
- Develop skills to monitor environmental changes and contribute to disaster response strategies.
Project/Lesson Overview
This project/lesson aims to equip users with the skills and tools to monitor environmental changes, contributing to disaster response and long-term mitigation strategies. By the end of the lesson, users will have a deeper understanding of the role of data in addressing environmental challenges and advancing sustainable solutions.
Explanation of the Content:
This passage describes the conditions and factors contributing to a wildfire in Los Angeles County in January 2025, including:
- Meteorological conditions: High winds (Santa Ana winds) and dry weather made the region highly susceptible to fire.
- Vegetation buildup: Due to the wet years of 2022-2024, vegetation in the hills and foothills of California built up significantly, providing ample fuel for the fire.
- Hydroclimate whiplash: A rapid transition from wet to dry conditions (hydroclimate whiplash) contributed to the fire risk by creating an environment where vegetation grew abundantly but was later dried out.
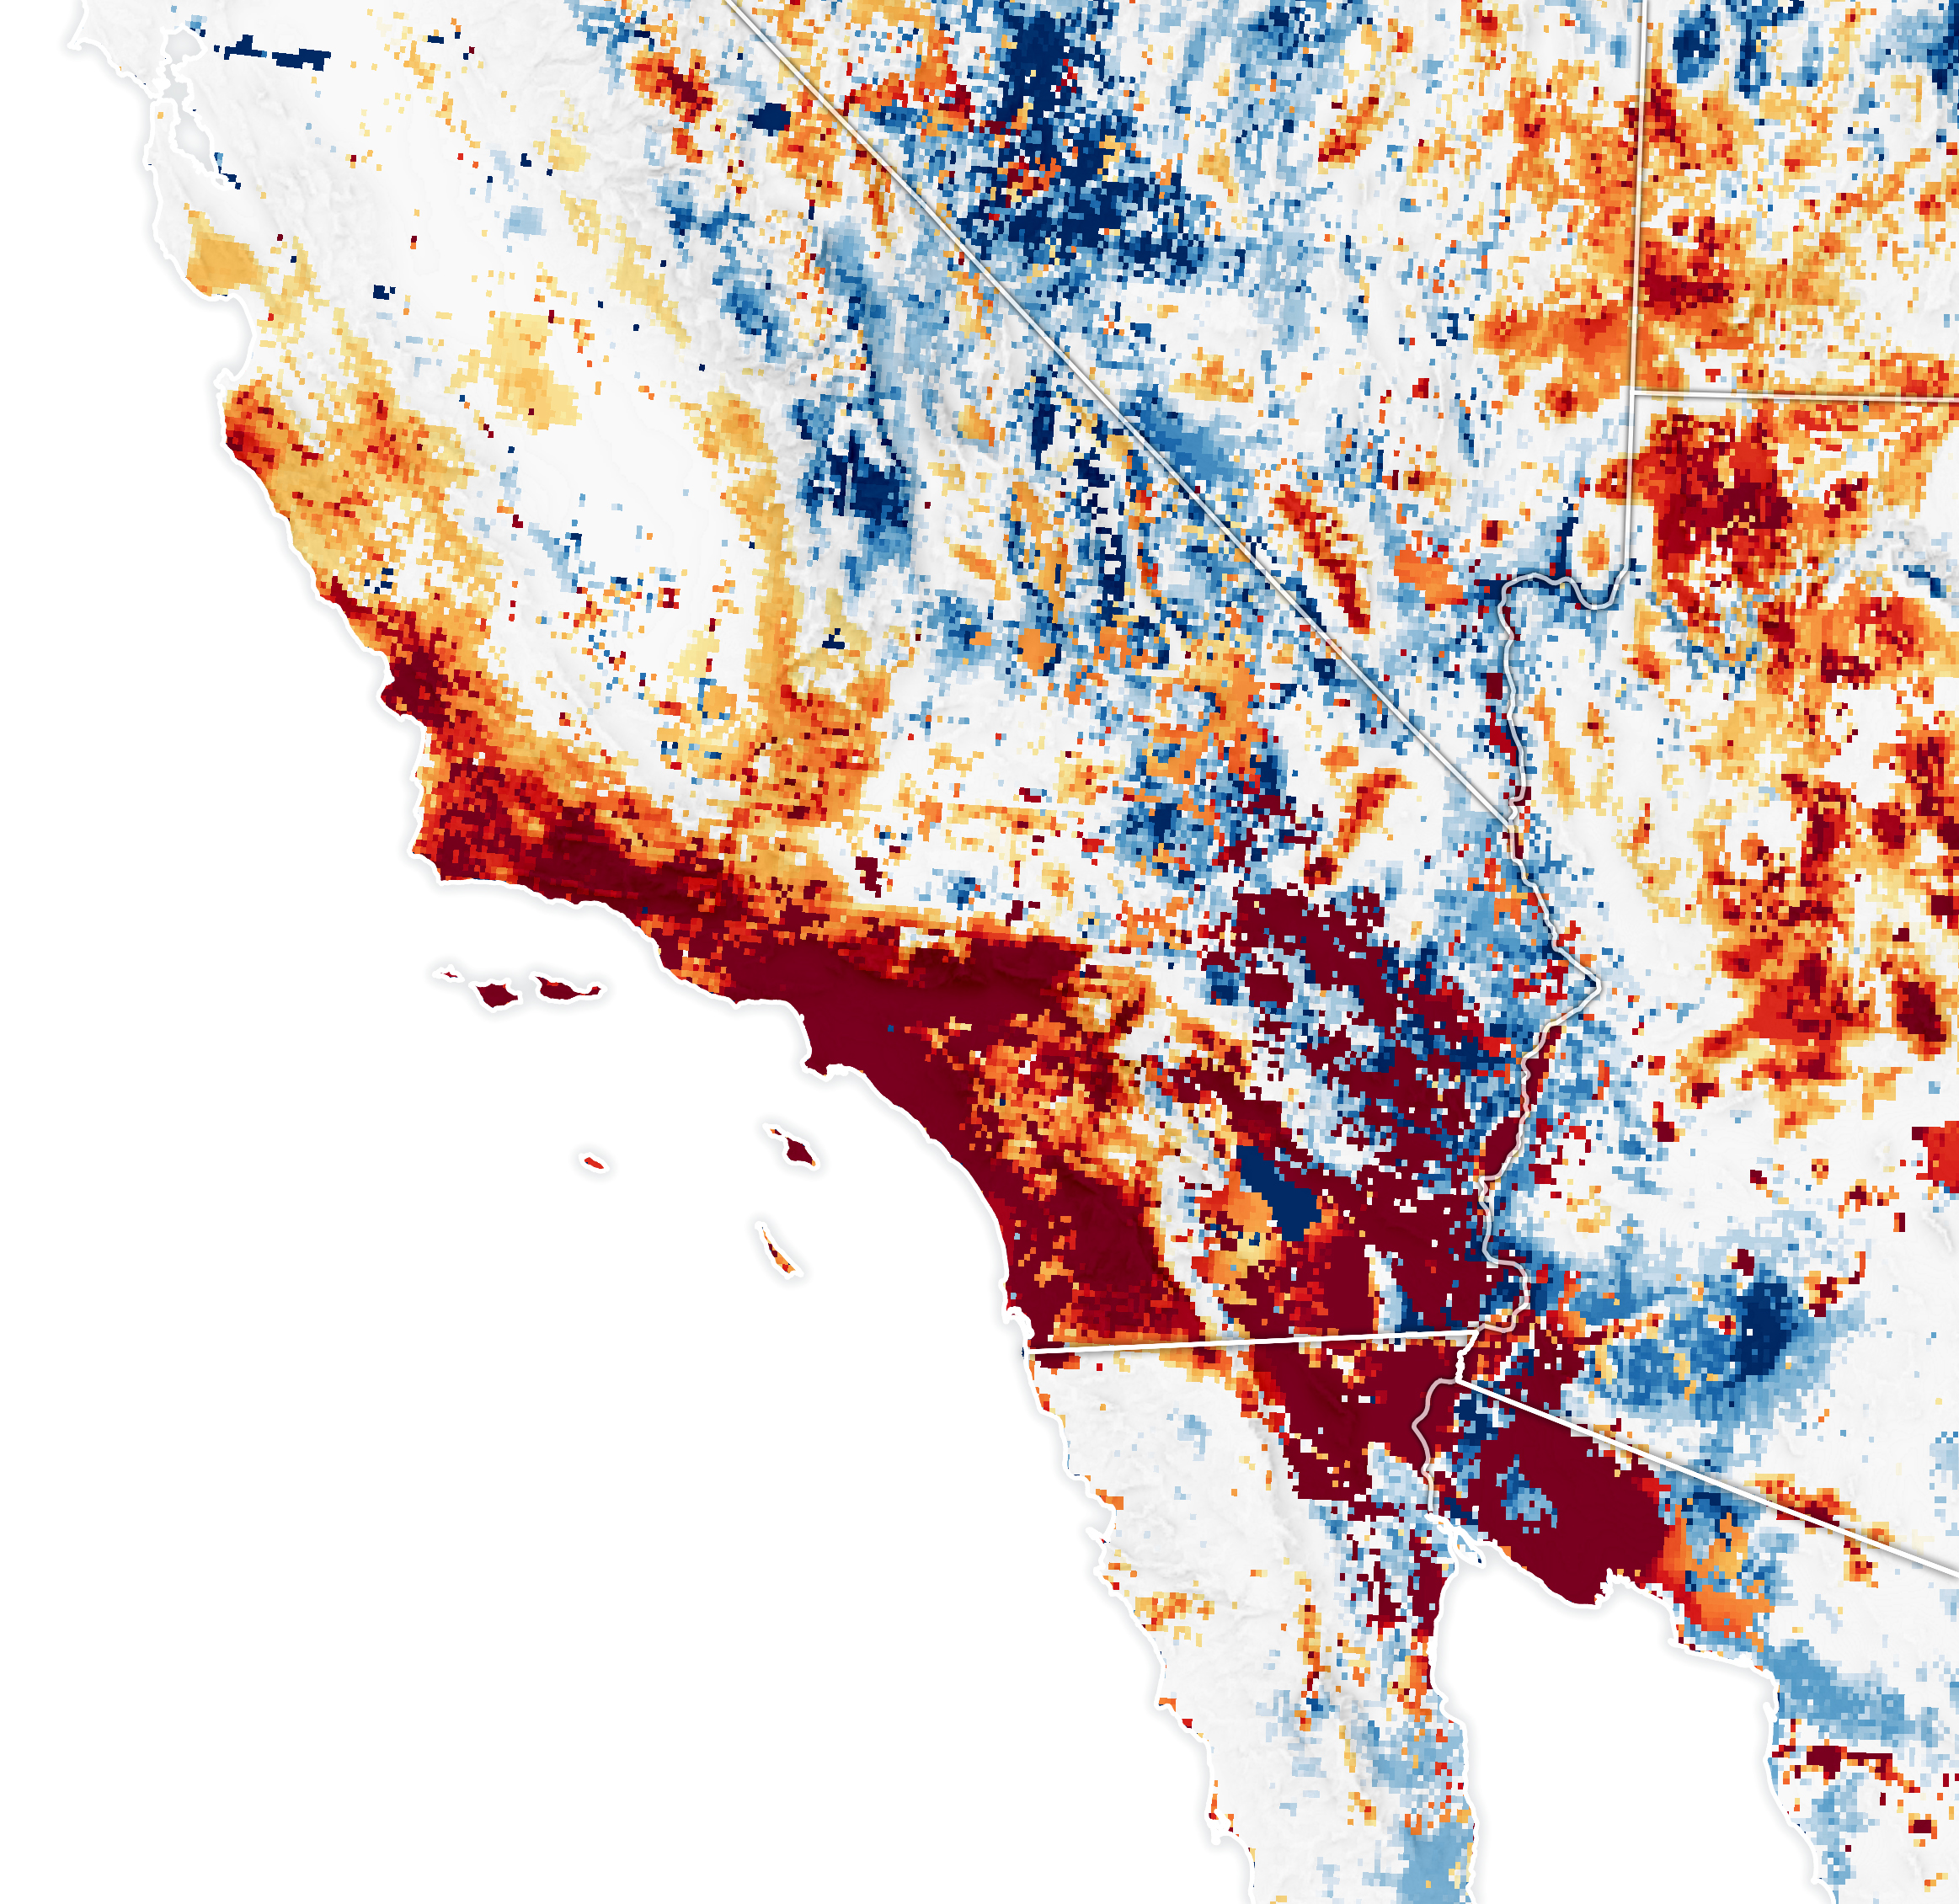
- Satellite data (NDVI): The Normalized Difference Vegetation Index (NDVI), which uses satellite imagery from Landsat, shows that vegetation in the area was 30% greener than average. This indicates that a large amount of fuel (plants) was available to burn.
- Soil moisture: Despite the vegetation growth from the wet years, the soil moisture was extremely low (in the bottom 2% historically) by January 7, 2025. Low soil moisture is often associated with dry conditions that contribute to more intense fires.
Air Quality in California Before and After Recent Wildfires
-The January 2025 wildfires in California, particularly around Los Angeles, had a profound impact on air quality, with significant variations observed before, during, and after the events.
Before
Prior to the wildfires, air quality in the greater Los Angeles region was generally within acceptable standards. Measurements of fine particulate matter (PM2.5) typically remained below the U.S. Environmental Protection Agency’s (EPA) safety threshold of 35 micrograms per cubic meter (µg/m³), indicating healthy air conditions.
During
The onset of the wildfires on January 7, 2025, led to a rapid and severe deterioration in air quality:
PM2.5 Levels: Monitoring stations recorded alarming spikes in PM2.5 concentrations. For instance, the Harrison Elementary School station reported levels reaching 184.1 µg/m³, approximately 36.8 times the World Health Organization’s annual guideline value. Other stations across Los Angeles County registered one-hour peaks as high as 483.7 µg/m³, categorizing the air quality as hazardous.
Health Advisories: Authorities issued warnings urging residents, especially those with respiratory conditions, to remain indoors, utilize air purifiers, and wear N95 masks when necessary. Symptoms such as burning eyes, throat irritation, and exacerbated respiratory issues were commonly reported.
After
Following the containment of the fires, air quality began to improve; however, certain concerns persisted:
Residual Pollution: While PM2.5 levels gradually declined to safer ranges, some areas continued to experience elevated concentrations due to lingering smoke and resuspended ash particles. Residents were advised to continue monitoring air quality reports and take precautions during outdoor activities.
Soil and Water Contamination: The combustion of urban structures released hazardous substances, including heavy metals like lead and zinc, into the environment. These contaminants posed risks of soil and water pollution, necessitating ongoing environmental assessments and remediation efforts.
# Air Quality Data Visualization
days = np.array(["Before (Jan 1-6)", "During (Jan 7-12)", "After (Jan 13-18)"])
pm25_levels = np.array([12, 184, 45]) # values in µg/m³
plt.figure(figsize=(8, 5))
plt.bar(days, pm25_levels, color=["green", "red", "orange"])
plt.xlabel("Time Period")
plt.ylabel("PM2.5 Concentration (µg/m³)")
plt.title("Air Quality Before, During, and After the 2025 California Wildfires")
plt.ylim(0, 200)
plt.show()
Understanding the Graph: Air Quality Before, During, and After the 2025 California Wildfires
This graph provides a clear visualization of how the 2025 California wildfires affected air quality, measured through PM2.5 concentration levels (µg/m³)—a key indicator of air pollution. PM2.5 refers to fine particulate matter with a diameter of 2.5 micrometers or smaller, which can penetrate deep into the lungs and pose severe health risks.
Before the Wildfire (Jan 1-6) – Safe Air Quality
PM2.5 Level: 12 µg/m³ (green bar)
Air quality was within EPA’s safe standard (below 35 µg/m³), meaning most people could breathe easily without health risks.
Conditions consisted of Clear skies, good visibility, and minimal respiratory risks for sensitive groups (children, elderly, and those with asthma or heart disease).
During the Wildfire (Jan 7-12) – Hazardous Air Quality
PM2.5 Level: 184 µg/m³ (red bar)
A dramatic spike in air pollution due to massive smoke, ash, and airborne particles.
Health Impacts:
Severe health risks for everyone, not just sensitive groups. Increased respiratory issues, eye irritation, throat discomfort, and aggravated heart conditions. Authorities issued health warnings, urging people to stay indoors, wear N95 masks, and use air purifiers.
Environmental Impact:
Smoke spread across cities like Los Angeles, Sacramento, and San Francisco, causing poor visibility. Nearby vegetation and wildlife suffered from the intense particulate matter.
After the Wildfire (Jan 13-18) – Lingering Pollution
PM2.5 Level: 45 µg/m³ (orange bar)
Though air quality improved as fires were contained, it remained above safe levels due to residual smoke and ash particles still circulating.
Continued Risks:
Respiratory irritation and discomfort persisted, especially in affected regions. Air quality fluctuated based on wind patterns and weather conditions. Some areas required weeks or months to return to pre-wildfire conditions.
Long-term Effects:
Possible soil and water contamination from the burnt debris. Risk of secondary pollution as wind carries ash and fine particulates over time.
## soil moisture data (values in %)
dates = pd.date_range(start="2024-12-20", periods=10, freq='D')
soil_moisture_before = np.array([35, 34, 36, 33, 31, 30, 28, 27, 25, 24]) # Before wildfire
dates_after = pd.date_range(start="2025-01-10", periods=10, freq='D')
soil_moisture_after = np.array([20, 19, 18, 16, 15, 14, 13, 12, 11, 10]) # After wildfire
# Creates DataFrames
df_before = pd.DataFrame({'Date': dates, 'Soil Moisture (%)': soil_moisture_before})
df_after = pd.DataFrame({'Date': dates_after, 'Soil Moisture (%)': soil_moisture_after})
# Print summary statistics
print("Soil Moisture Data Before the Wildfire:\n", df_before.describe(), "\n")
print("Soil Moisture Data After the Wildfire:\n", df_after.describe(), "\n")
# Plotting the data
plt.figure(figsize=(10, 5))
plt.plot(df_before['Date'], df_before['Soil Moisture (%)'], marker='o', linestyle='-', color='blue', label="Before Wildfire")
plt.plot(df_after['Date'], df_after['Soil Moisture (%)'], marker='s', linestyle='-', color='red', label="After Wildfire")
plt.xlabel("Date")
plt.ylabel("Soil Moisture (%)")
plt.title("Soil Moisture Levels Before and After the 2025 California Wildfire")
plt.legend()
plt.xticks(rotation=45)
plt.grid()
plt.show()Soil Moisture Data Before the Wildfire:
Date Soil Moisture (%)
count 10 10.000000
mean 2024-12-24 12:00:00 30.300000
min 2024-12-20 00:00:00 24.000000
25% 2024-12-22 06:00:00 27.250000
50% 2024-12-24 12:00:00 30.500000
75% 2024-12-26 18:00:00 33.750000
max 2024-12-29 00:00:00 36.000000
std NaN 4.217688
Soil Moisture Data After the Wildfire:
Date Soil Moisture (%)
count 10 10.000000
mean 2025-01-14 12:00:00 14.800000
min 2025-01-10 00:00:00 10.000000
25% 2025-01-12 06:00:00 12.250000
50% 2025-01-14 12:00:00 14.500000
75% 2025-01-16 18:00:00 17.500000
max 2025-01-19 00:00:00 20.000000
std NaN 3.425395

Key Insights
- Before the wildfire: Soil moisture was relatively stable, averaging around 30-35%, which supported healthy vegetation and maintained soil structure.
- After the wildfire: Soil moisture dropped significantly, averaging 10-20%, indicating extreme dryness and reduced ability to retain water.
- Loss of Organic Matter: The fire burned away plant cover and organic matter, reducing the soil’s ability to absorb and retain water, further accelerating moisture loss.
- Erosion Risk: With decreased moisture and vegetation cover, the soil is now highly vulnerable to wind and water erosion, leading to loss of topsoil and nutrients.
- Increased Risk of Landslides: Burned and dried-out soil loses stability, raising the likelihood of landslides, particularly in hilly or mountainous regions after heavy rains.
- Impact on Vegetation Regrowth: Seeds and root systems may struggle to establish due to dry, compacted, and nutrient-depleted soil, delaying ecosystem recovery.
- Hydrophobic Soil Formation: Some areas may develop hydrophobic (water-repellent) soil layers, preventing water infiltration and increasing surface runoff, which can lead to flash floods.
- Long-Term Recovery: Soil rehabilitation may take months to years, depending on precipitation, restoration efforts, and natural ecosystem resilience.